top of page

Table Share®
A Decision Platform — Not a Static Report

Go Beyond the Top 15: Your Gateway to 400+ Dishes and Behaviours. From Insight to Impact: The Table Share® Dashboard is built to elevate your Strategic Agility.
Beyond Availability: Informing your Urban Market Strategy with Actual Consumption Metrics
Purchase ≠ Consumption
Our data goes beyond the cart—capturing what’s served and eaten at the table.
Recall distorts reality
Monthly recall misses everyday food behaviour.
Categories hide occasions
Growth happens at the meal moment, not the shelf.
If you don’t know what’s eaten, you can’t know what will grow!
India Eats 7 Times a Day

Each occasion has different foods, needs, and competitive sets.Table Share® maps them independently — and accurately.
Where Food Comes From Matters
Homemade is still dominant — but uneven across dishes.
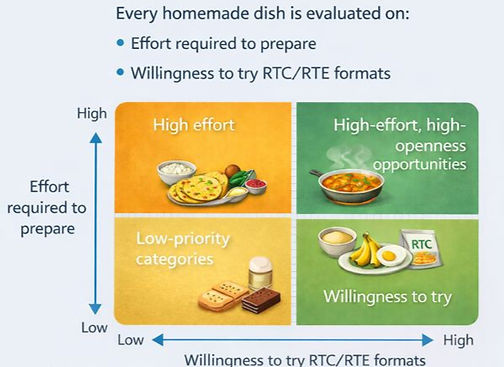
RTC / RTE / Takeaway Adoption driven by effort
Convenience doesn’t replace cooking. It replaces effort.
Why Penetration Isn’t Enough

Growth follows volume relevance — not just reach.
Built for Real Business Decisions
Marketing
Occasion-led messaging & positioning
Innovation:
RTC/RTE white-space identification
Sales
City & channel prioritisation
Strategy
Portfolio gaps & long-term bets
What You Receive
Executive Overview Rerport
Interactive Dashboard
Analysis Support & Interpretation
Note: Custom extensions available by category, market, or target group.

If your product isn’t winning at the table, it won’t win at retail.
Join the Culinary Revolution
Table Share® isn’t just data—it’s your roadmap to staying relevant, responsive, and ahead in India’s urban food market.
Subscribe today to unlock the power of Table Share® for your business and get ready to shape the future of food.
bottom of page